You haven't signed in yet, you can have a better experience after signing in
 SigmaPlot 16 scientific plotting and advanced data statistical analysis software

Activity Rules
1、Activity time:{{ info.groupon.start_at }} ~ {{ info.groupon.end_at }}。
1、Activity time:cease when sold out。
2、Validity period of the Group Buying:{{ info.groupon.expire_days * 24 }} hours。
3、Number of Group Buying:{{ info.groupon.need_count }}x。
Please Pay Attention
1、Teamwork process: Join/initiate a Group Buying and make a successful payment - Within the validity period, the number of team members meets the activity requirements - Group Buying succeeded!
2、If the number of participants cannot be met within the valid period, the group will fail, and the paid amount will be refunded in the original way.
3、The number of people required and the time of the event may vary among different products. Please pay attention to the rules of the event.
SigmaPlot is a powerful and versatile scientific tool used for data analysis and visualization.
Designed specifically for the needs of scientists, professional researchers, and engineers.
With an award-winning interface and intuitive wizard technology, SigmaPlot can gradually guide users through the process of graphic creation and data analysis. SigmaPlot provides flexibility to create engaging graphics and statistical analysis that you cannot achieve with basic spreadsheet software.
summary
- SigmaPlot can help you quickly create accurate charts
Using the new graphical attribute user interface, you can select attribute categories in the tree on the left and then change attributes on the right. The changes will be immediately drawn into a graphic. If you move the cursor out of the panel, it will become transparent and you can see the effect of the changes without leaving the panel.
- Over 100 types of 2D and 3D technology graphics
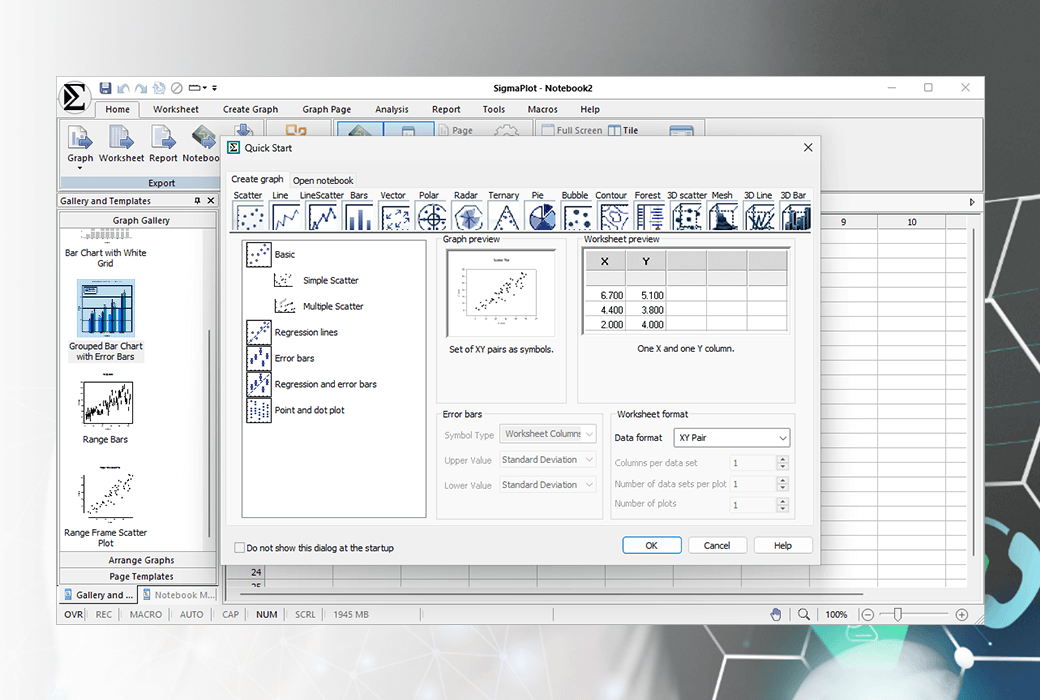
From simple 2-D scatter plots to striking contour maps and new radar and point density maps, SigmaPlot provides you with the exact technical graphic types you need in demanding research.
- Analyzing multiple data when fitting contracts using global curves
Global curve fitting is used to simultaneously fit equations to multiple datasets. The selected equation must have exactly one independent variable.
- Obtain data from almost any source
SigmaPlot has an import file format for all common text files. This includes a universal ASCII file import program that allows importing comma separated files and user-defined separators.
SigmaPlot function
- Choose various chart types to present your results in the best way possible
From simple 2-D scatter plots to striking contour maps and new radar and point density maps, SigmaPlot provides you with the exact technical map types you need in demanding research.
- Statistical analysis is no longer a daunting task
SigmaPlot now provides almost 50 of the most commonly used statistical tests in scientific research by integrating SigmaStat into one application. The software provides the most suitable statistical testing recommendations. Accept raw and indexed data formats to avoid data reformatting.
- Share high-quality charts and data online
Export your charts as high-resolution, dynamic web pages instead of simple GIF or JPEG files. Viewers can directly view the data used to create charts in a web browser, and can zoom, pan, or print full resolution images. Automatically generate active web page objects from your charts, or embed these objects into other web pages.
Import
- Excel, ASCII Plain Text, comma separated, MS Access
- Universal ASCII Import Filter
- SigmaPlot DOS 4.0, 4.1, 5.0 data worksheets, SigmaPlot 1.0, 2.0 worksheets, as well as 3.0, 4.0, 5.0, 6.0, 7.0, 8.0, 9.0, 10.0, and 11.0 Windows, SigmaPlot 4.1, and 5.0 Macintosh data worksheets
export
- Excel, ASCII Plain Text, comma separated, MS Access
- Universal ASCII Import Filter
- SigmaPlot DOS 4.0, 4.1, 5.0 data worksheets, SigmaPlot 1.0, 2.0 worksheets, as well as 3.0, 4.0, 5.0, 6.0, 7.0, 8.0, 9.0, 10.0, and 11.0 Windows, SigmaPlot 4.1, and 5.0 Macintosh data worksheets
- Comma separated and universal ASCII import filter
- Symphony, Quattro Pro, dBASE E, DIF, Lotus 1-2-3, Paradox
- SigmaStat DOS and 1.0 worksheet, SYSTAT, SPSS, SAS dataset V6. V8, V9, SAS export files, Minitab V8 to V12
Mapping software makes data visualization simple
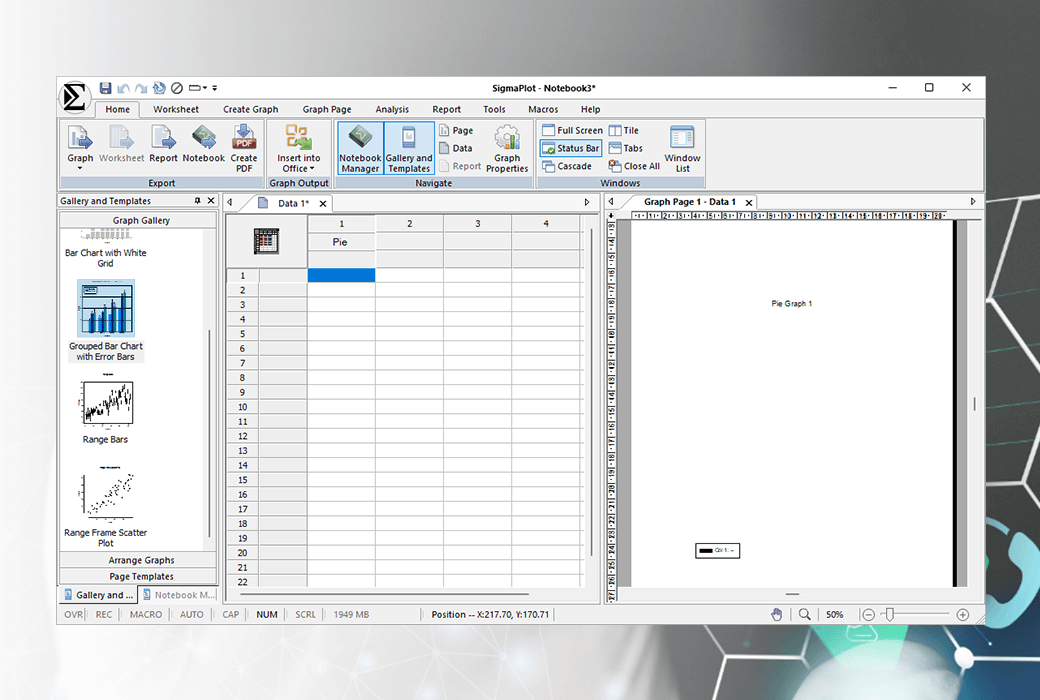
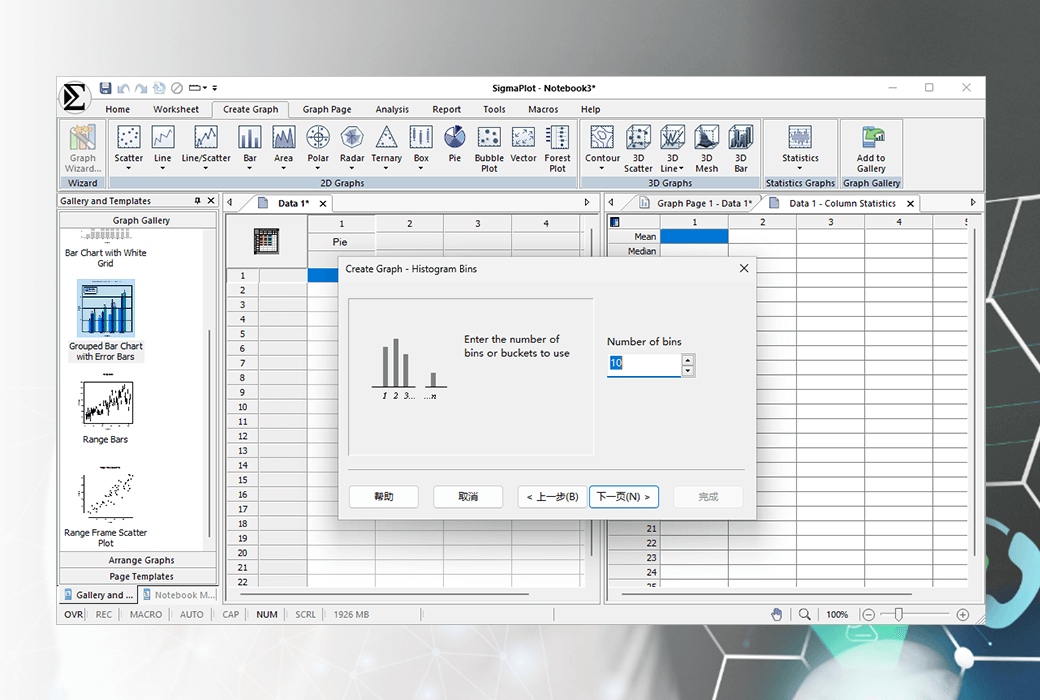
Graphic creation began with SigmaPlot's award-winning interface. Utilize the tab selection, right-click support, and graphic preferences for the collection of common attributes in the ribbon, charts, worksheets, and reports. Select the type of graphic you want to create from the easy to read icon in the graphic toolbar. The interactive graphic wizard will guide you through every step of graphic creation. You can immediately get eye-catching, publishing quality charts and graphics. SigmaPlot provides more options for charting, modeling, and plotting your technical data than any other graphical software package.
Customize every detail of your charts and graphs
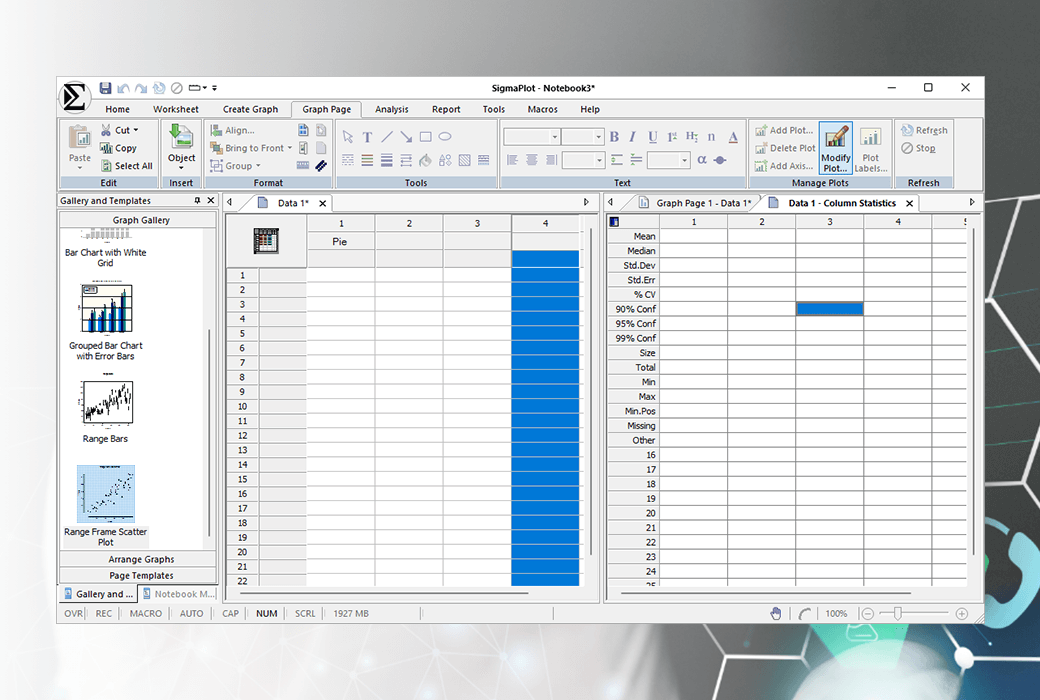
SigmaPlot provides flexibility to customize every detail of the chart. You can add axis breakpoints, standard or asymmetric error lines and symbols; Change color, font, line thickness, etc. Double click any chart element to launch the Chart Properties dialog box. Further modify your charts, graphs, or diagrams by pasting equations, symbols, maps, images, illustrations, or other graphics into your presentation. And choose anti aliasing to display smooth lines without aliasing, which can be used for your PowerPoint ® In the presentation.
Quickly draw your data using existing graphic templates in the graphic style library
Save all properties of your favorite graphic styles in the graphic style library. By quickly calling the existing graphic types you need and applying their styles to the current dataset, it adds faster and more efficient speed to analysis.
Publish your charts and graphics anywhere
Create stunning slides to showcase your charts in reports, or further customize your charts in drawing software. Use SigmaPlot's various graphic export options to save charts for publication in technical journals, articles, or papers. Displaying and publishing your results has never been so simple - or so impressive.
Data analysis will not become easier
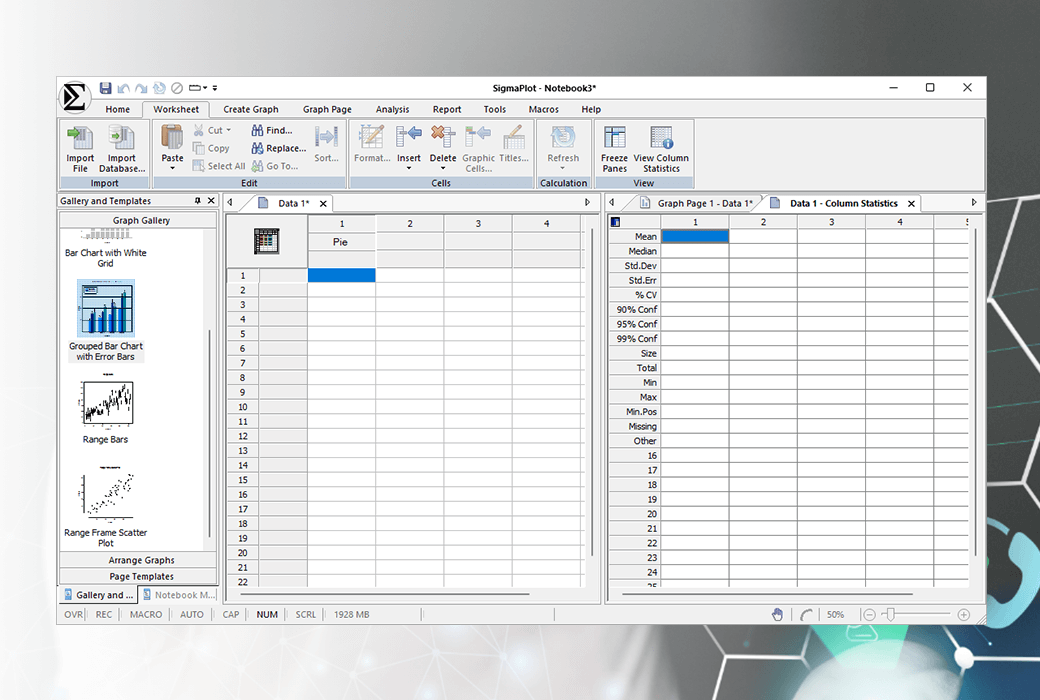
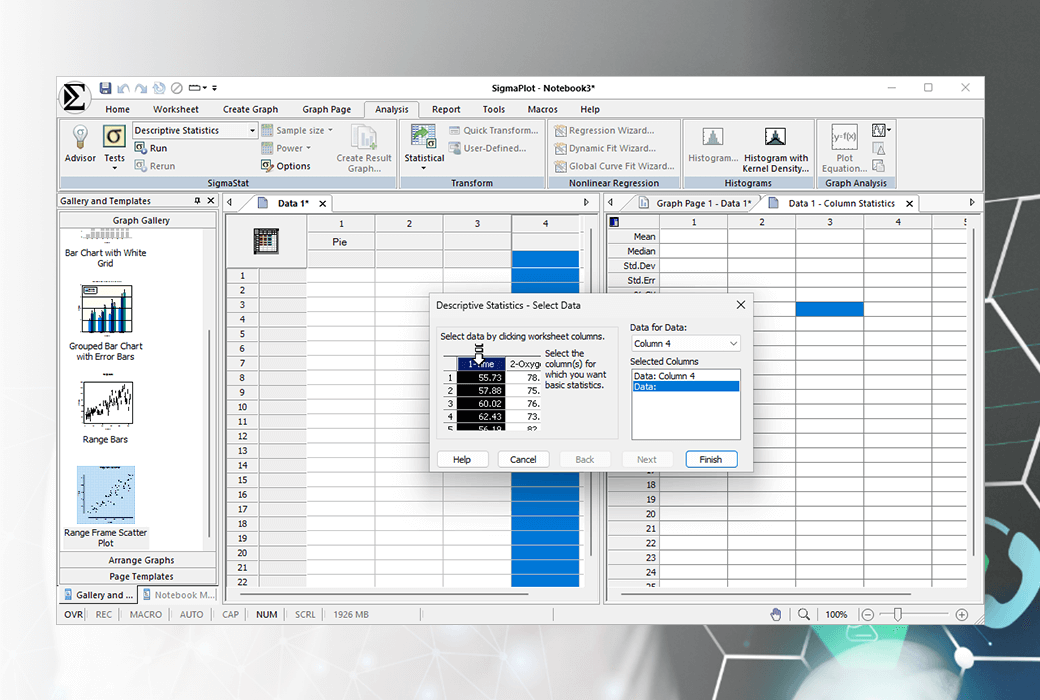
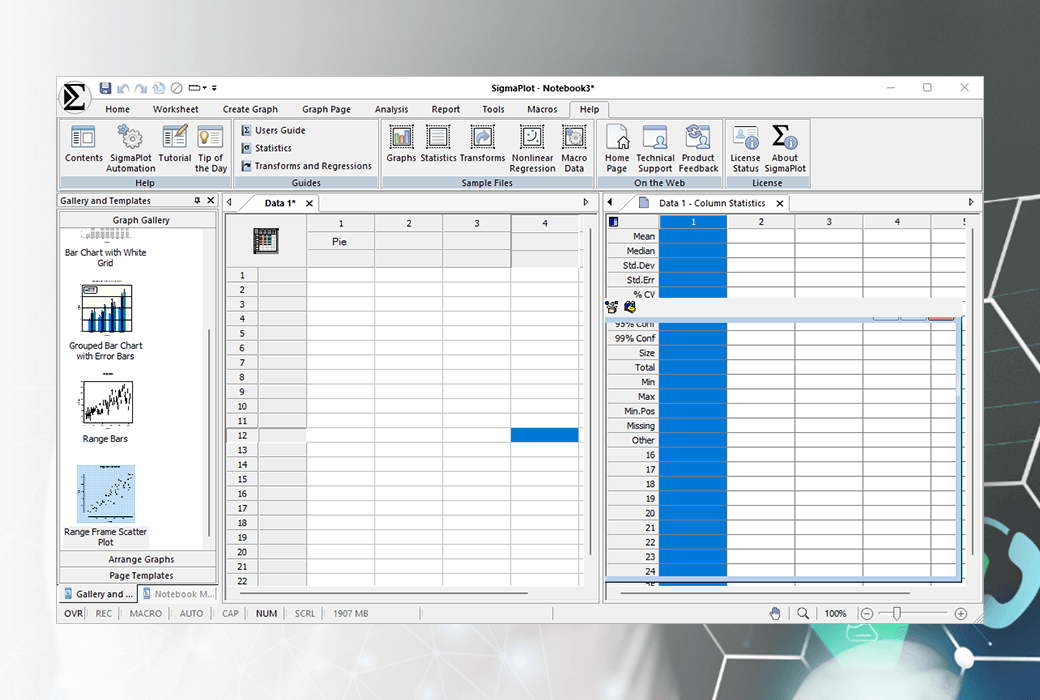
SigmaPlot provides all the basic tools you need to analyze data, from basic statistics to advanced mathematical calculations. Click the 'View Column Statistics' button to immediately generate summary statistics including 95% and 99% confidence intervals. Easily run t-tests, linear regression, nonlinear regression, and analysis of variance. You can fit a curve or plot a function and get a result report in seconds. Use built-in conversions to process data and create unique charts, graphs, or graphics. Using SigmaPlot - Everything is so easy!
Using SigmaPlot in Microsoft Excel
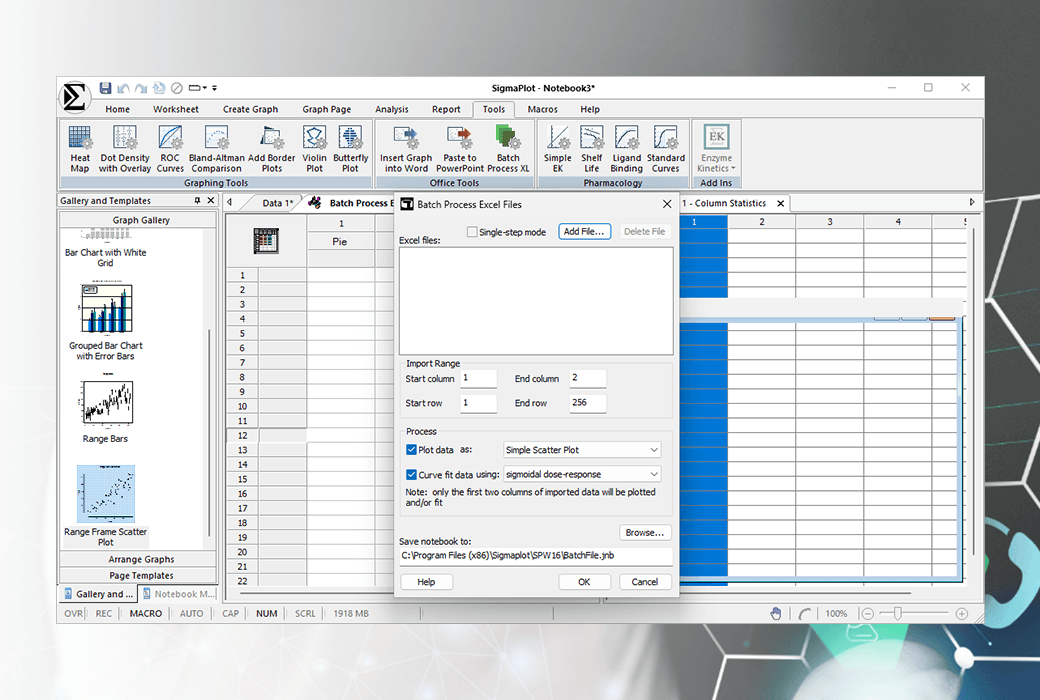
Access SigmaPlot directly from your activity Microsoft Excel worksheet. When you launch the SigmaPlot chart wizard from the Excel toolbar, it will eliminate the tedious steps of copying and pasting data preparation. Rest assured to use Excel cell formulas, pivot tables, macros, and date or time formats. Save data and graphics in a convenient file.
Transformation and Fast Transformation
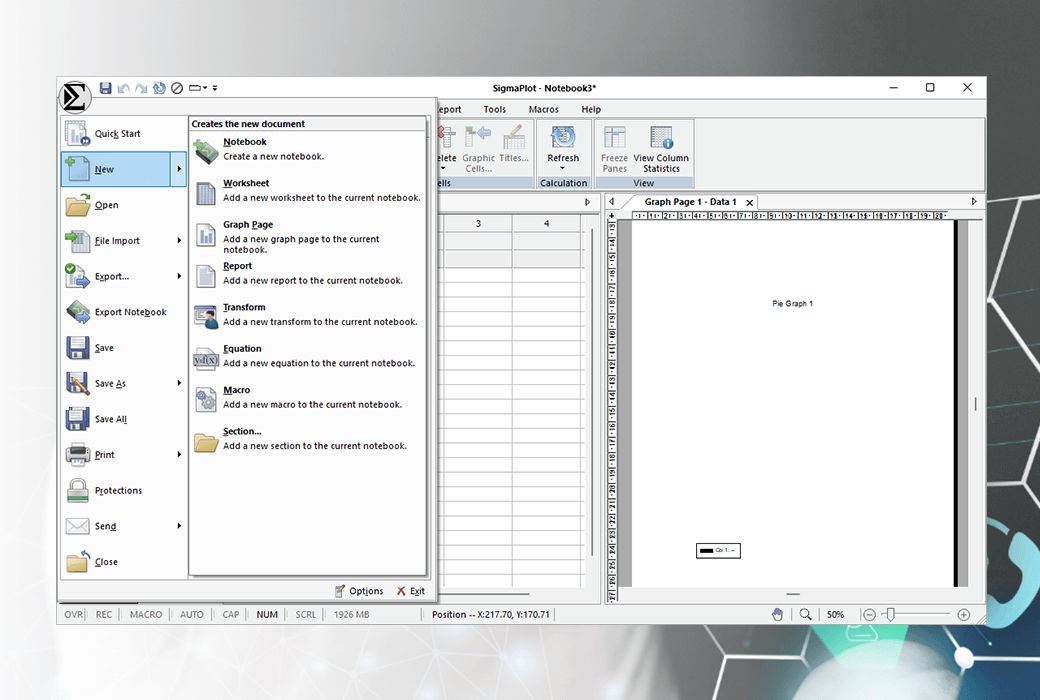
Generate simulated data or modify data worksheet columns using transformations. Create a simple one line conversion using the quick conversion feature, which will guide you through the conversion implementation. Or create extremely complex transformations using hundreds of lines of code.
Use the regression wizard to easily and accurately fit data
Use the SigmaPlot regression wizard to easily fit your data. The regression wizard will automatically determine your initial parameters, write a statistical report, save the equations to the SigmaPlot notebook, and add the results to an existing graph or create a new graph!
Use a dynamic curve fitter to determine if your fit is valid
The dynamic curve fitter uses your equation and data to perform 200 or more curve fits, starting from the best initial values. The results are ranked by goodness of fit so that you can compare the top ranked results with the results obtained from the regression wizard.
Almost any mathematical function can be plotted
To draw user-defined and parameterized equations, simply click on the "Draw Equations" function. Just input a function or select one from the built-in libraries, and specify the parameters and range. It's that simple! Create your own built-in functions and save them for future use. Draw functions on new or existing charts, or use different parameter values to draw multiple functions simultaneously. Save the drawn X and Y results to a worksheet.
The new worksheet features include
- Import Excel worksheet data into SigmaPlot worksheet or open an Excel worksheet as an Excel worksheet in SigmaPlot
- Mini toolbar for worksheet unit editing
- Zoom enabled worksheet
- Use the mouse wheel to scroll the worksheet
- Line width can be customized in the worksheet for graphic design
- Format text (subscripts, etc.) in worksheet cells
The notebook function of SigmaPlot
- Can save SigmaPlot worksheets, Excel worksheets, reports, documents, regression wizard equations, graphical pages, and macros.
- The new dialog based notebook has several states: docked, resized, hidden, summary information mode, etc.
- Browser like notebook function, supporting drag and drop functionality
- Directly edit notebook summary information
- Automated routine and complex tasks
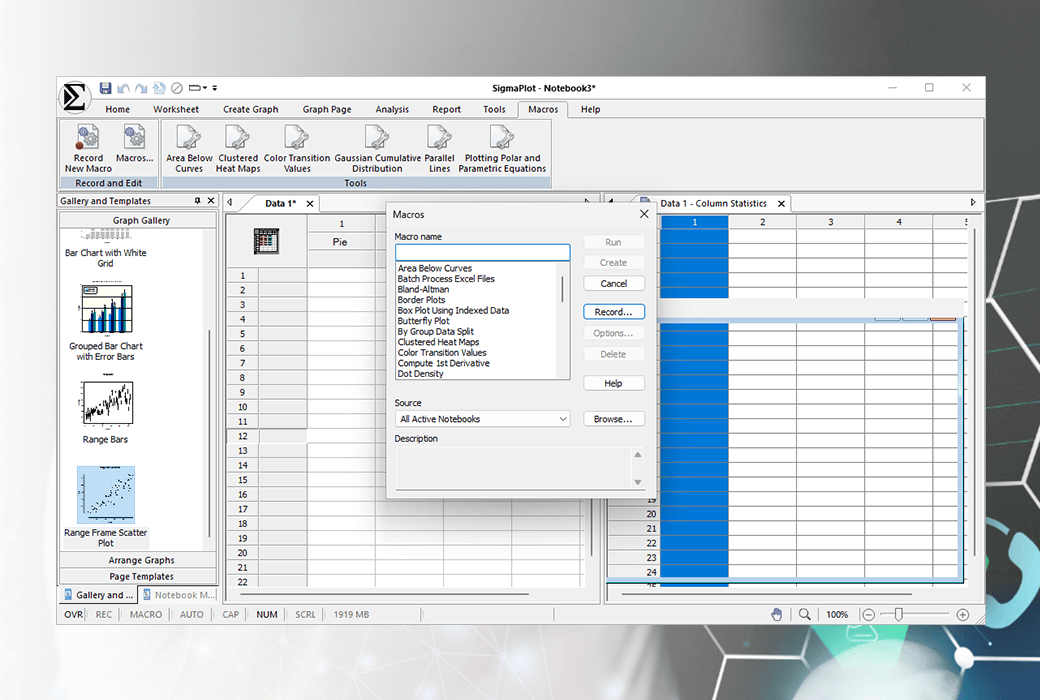
- Using the built-in macro language interface for Visual Basic compatible programming
- Macro recorder is used for saving and playback operations
- Fully Automated Object Support - Create your own SigmaPlot based application using Visual Basic
Symbol type
- More than 100 symbol types
- 30 new symbol types, including semi filled and BMW style
- Edit fonts when using text as symbols
- Access new symbols directly from the graph properties dialog box, toolbar, legend page, and symbol dialog box
SigmaPlot Report Editor
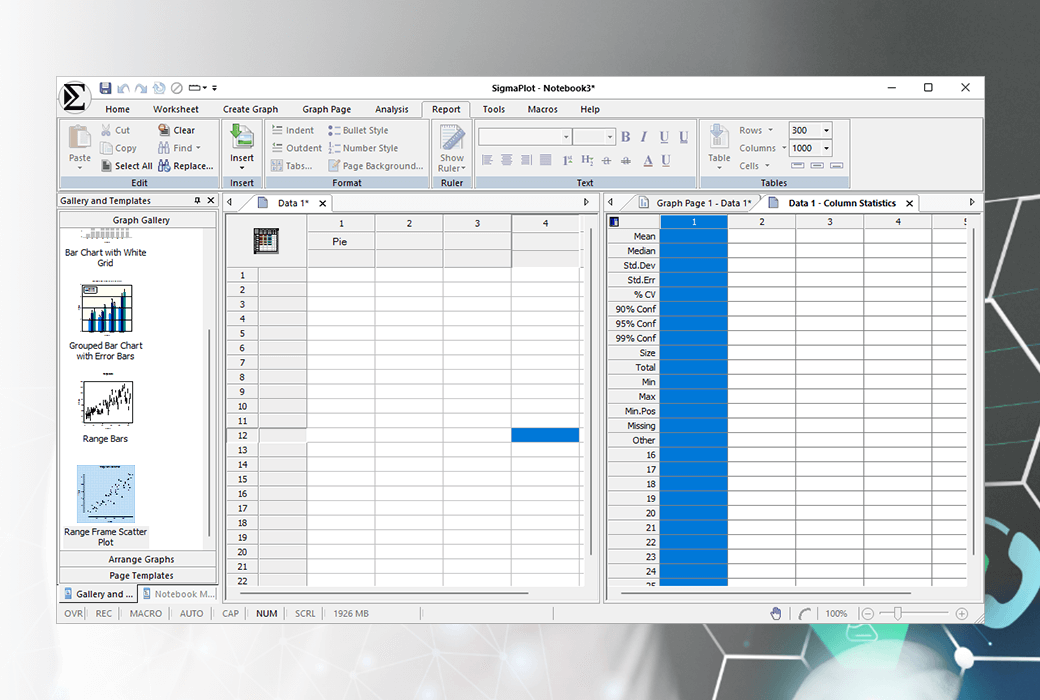
- Cut, paste, or combine all important aspects of the analysis into one document using OLE.
- Copy/paste table data between reports and Excel worksheets
- Choose various styles, sizes, and colors from any system font
- The new table has pre-defined styles or user-defined options
Page layout and annotation options
- OLE 2 containers and servers
- Automatic or manual legend
- What you see is what you get
- Multiline Text Editor
- Draw multiple curves and charts on a single chart

Official website:https://grafiti.com/sigmaplot-detail/
Download Center:https://sigmaplot.apsgo.cn
Backup Download:N/A
Delivery time:Manual processing
Operating Platform:Windows
Interface language:Support English interface display.
Update Description:Support minor version updates and upgrades (v16. x)
Trial before purchase:30 day free trial.
How to receive goods:After purchase, the activation information will be sent to the email address at the time of placing the order, and the corresponding product activation code can be viewed in the personal center, My Orders.
Number of devices:Can install 2 computers.
Replace computer:Uninstall the original computer and activate the new computer.
Activation guidance:https://apsgo.com/store/product/sigmaplot#faq,1069
Special note:To be added.
reference material:https://grafiti.com/installation-activation/

Any question
{{ app.qa.openQa.Q.title }}
What is the trial serial number for SigmaPlot 16?
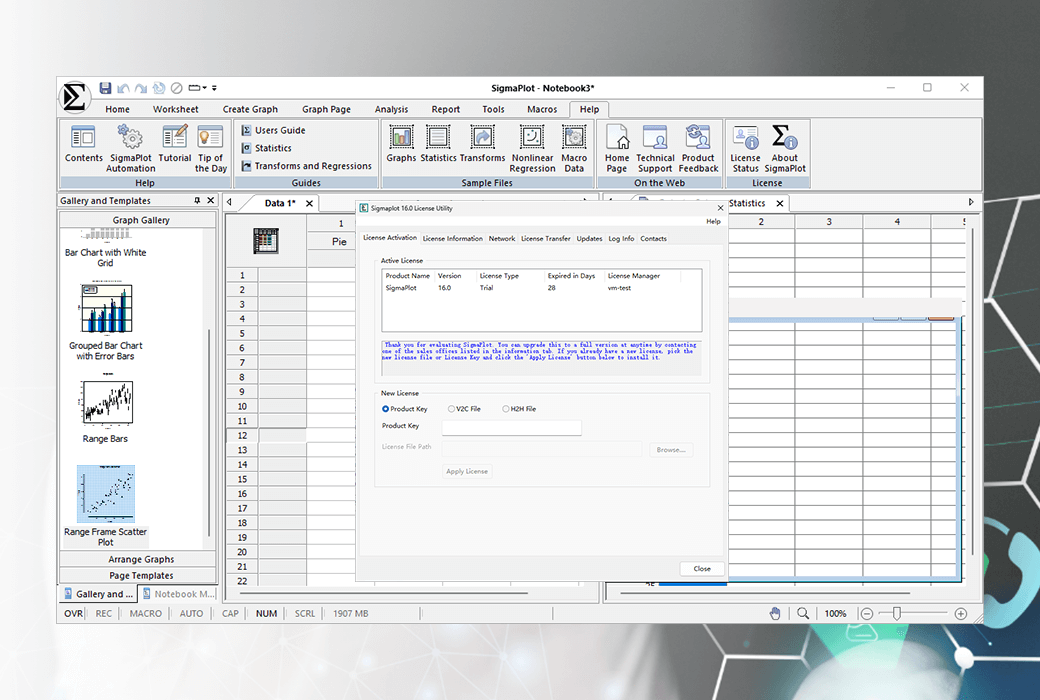
When installing SigmaPlot 16, you need to fill in the serial number and name before proceeding to the next step of installation. Please fill in this serial number when installing:775600001
If you purchase, you will receive an official serial number, which is the basic information for the user to apply for the license file in the future.
SigmaPlot download link:https://sigmaplot.apsgo.cn/


